
Press release
Polyphenylene Ether Alloy Market Size is Estimated to Reach USD 2,453.2 Million by 2030
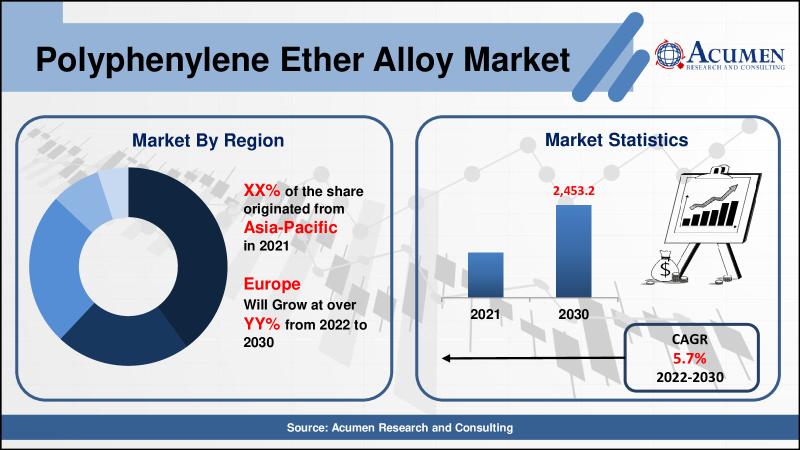
Acumen Research and Consulting, a global provider of market research studies, recently published a report titled "Polyphenylene Ether Alloy Market (By Product - PPE/PS, PPE/PA, PPE/PP, Others; By End User - Automotive, Electrical & Electronics, Industrial, Others) - Global Industry Size, Share, Trends and Forecast, 2022 - 2030". Polyphenylene ether (PPE) is a class of polymers which contains phenolic monomers attached. On the basis of monomer types used in the polymerization, a variety of homopolymers and copolymers can be produced which are used a wide array of application. In combination with polystyrene, these polyphenylene ether combine to form single phase alloys in contrast to the other phases gained with most other polymer blends. Meanwhile polyphenylene ether and polystyrene are completely miscible. By blending PPE with impact modified polystyrene at different ratios, the final component opaque thermoplastic resins have a wide range of chemical, thermal, and mechanical properties. A huge grade of polyphenylene ether is available in the market.
Download Sample@ https://www.acumenresearchandconsulting.com/request-sample/735
To purchase report: Sales@acumenresearchandconsulting.com
Market Dynamics
The polyphenylene ether market is majorly driven by increasing demand from automotive industries, rising electronics manufacturing and increasing need for the better products. PPE/PA type is most widely used type of polyphenylene ether alloy owing to its high toughness and increased resistance to chemical and organic solvents. Additionally, increasing demand for recycled plastic in electrical and electronics and demand for light weight components in automobiles will support the growth of the market. During last few years, increasing demand for the fuels has increased the attention of various companies and thus a number of companies are trying to introduce the better and lighter products for automotives, which will save the fuel. Light weight property of the alloy has supported the growth of the market. Conversely, high cost of the material and environmental issuers may hinder the growth of the market.
View Detail Information @ https://www.acumenresearchandconsulting.com/polyphenylene-ether-alloy-market
Table of Contents
CHAPTER 1. INDUSTRY OVERVIEW
1.1. Definition and Scope
1.1.1. Definition of Infant Formula Ingredients
1.1.2. Market Segmentation
1.1.3. List of Abbreviations
1.2. Summary
1.2.1. Market Snapshot
1.2.2. Infant Formula Ingredients Market By Type
1.2.2.1. Global Infant Formula Ingredients Market Revenue and Growth Rate Comparison By Type (2015-2026)
1.2.2.2. Global Infant Formula Ingredients Market Revenue Share By Type in 2017
1.2.2.3. Carbohydrates
1.2.2.4. Oils & Fats
1.2.2.5. Proteins
1.2.2.6. Vitamins & Minerals
1.2.2.7. Prebiotics
1.2.2.8. Others
1.2.3. Infant Formula Ingredients Market by Application
1.2.3.1. Global Infant Formula Ingredients Market Revenue and Growth Rate Comparison by Application (2015-2026)
1.2.3.2. Global Infant Formula Ingredients Market Revenue Share by Application in 2017
1.2.3.3. Growing-Up Milk (Infants Over 12 Months)
1.2.3.4. Standard Infant Formula (0-6-Month-Old Infant)
1.2.3.5. Follow-On Formula (6-12 Month-Old Infant)
1.2.3.6. Specialty Formula
1.2.3.7. Others
1.2.4. Infant Formula Ingredients Market By Form
1.2.4.1. Global Infant Formula Ingredients Market Revenue and Growth Rate Comparison By Form (2015-2026)
1.2.4.2. Global Infant Formula Ingredients Market Revenue Share Raw Material in 2017
1.2.4.3. Powder
1.2.4.4. Liquid & Semi-Liquid
1.2.5. Infant Formula Ingredients Market by Geography
1.2.5.1. Global Infant Formula Ingredients Market Revenue and Growth Rate Comparison by Geography (2015-2026)
1.2.5.2. North America Infant Formula Ingredients Market Revenue and Growth Rate (2015-2026)
1.2.5.3. Europe Infant Formula Ingredients Market Revenue and Growth Rate (2015-2026)
1.2.5.4. Asia-Pacific Infant Formula Ingredients Market Revenue and Growth Rate (2015-2026)
1.2.5.5. Latin America Infant Formula Ingredients Market Revenue and Growth Rate (2015-2026)
1.2.5.6. Middle East and Africa (MEA) Infant Formula Ingredients Market Revenue and Growth Rate (2015-2026)
CHAPTER 2. MARKET DYNAMICS AND COMPETITION ANALYSIS
2.1. Market Drivers
2.2. Restraints and Challenges
2.3. Growth Opportunities
2.4. Porter's Five Forces Analysis
2.4.1. Bargaining Power of Suppliers
2.4.2. Bargaining Power of Buyers
2.4.3. Threat of Substitute
2.4.4. Threat of New Entrants
2.4.5. Degree of Competition
2.5. Value Chain Analysis
2.6. Cost Structure Analysis
2.6.1. Raw Material and Suppliers
2.6.2. Manufacturing Process Analysis
2.7. Regulatory Compliance
2.8. Competitive Landscape, 2017
2.8.1. Player Positioning Analysis
2.8.2. Key Strategies Adopted By Leading Players
CHAPTER 3. MANUFACTURING PLANTS ANALYSIS
3.1. Capacity and Commercial Production Date of Global Infant Formula Ingredients Major Manufacturers in 2017
3.2. Manufacturing Plants Distribution of Global Infant Formula Ingredients Major Manufacturers in 2017
3.3. R&D Status and Technology Source of Global Infant Formula Ingredients Major Manufacturers in 2017
3.4. Raw Materials Sources Analysis of Global Infant Formula Ingredients Major Manufacturers in 2017
CHAPTER 4. INFANT FORMULA INGREDIENTS MARKET BY TYPE
4.1. Global Infant Formula Ingredients Revenue By Type
4.2. Carbohydrates
4.2.1. Market Revenue and Growth Rate, 2015 - 2026 ($Million)
4.2.2. Market Revenue and Forecast, By Region, 2015 - 2026 ($Million)
4.3. Oils & Fats
4.3.1. Market Revenue and Growth Rate, 2015 - 2026 ($Million)
4.3.2. Market Revenue and Forecast, By Region, 2015 - 2026 ($Million)
4.4. Proteins
4.4.1. Market Revenue and Growth Rate, 2015 - 2026 ($Million)
4.4.2. Market Revenue and Forecast, By Region, 2015 - 2026 ($Million)
4.5. Vitamins & Minerals
4.5.1. Market Revenue and Growth Rate, 2015 - 2026 ($Million)
4.5.2. Market Revenue and Forecast, By Region, 2015 - 2026 ($Million)
4.6. Prebiotics
4.6.1. Market Revenue and Growth Rate, 2015 - 2026 ($Million)
4.6.2. Market Revenue and Forecast, By Region, 2015 - 2026 ($Million)
4.7. Others
4.7.1. Market Revenue and Growth Rate, 2015 - 2026 ($Million)
4.7.2. Market Revenue and Forecast, By Region, 2015 - 2026 ($Million)
CHAPTER 5. INFANT FORMULA INGREDIENTS MARKET BY APPLICATION
5.1. Global Infant Formula Ingredients Revenue By Application
5.2. Growing-Up Milk (Infants Over 12 Months)
5.2.1. Market Revenue and Growth Rate, 2015 - 2026 ($Million)
5.2.2. Market Revenue and Forecast, By Region, 2015 - 2026 ($Million)
5.3. Standard Infant Formula (0-6-Month-Old Infant)
5.3.1. Market Revenue and Growth Rate, 2015 - 2026 ($Million)
5.3.2. Market Revenue and Forecast, By Region, 2015 - 2026 ($Million)
5.4. Follow-On Formula (6-12 Month-Old Infant)
5.4.1. Market Revenue and Growth Rate, 2015 - 2026 ($Million)
5.4.2. Market Revenue and Forecast, By Region, 2015 - 2026 ($Million)
5.5. Specialty Formula
5.5.1. Market Revenue and Growth Rate, 2015 - 2026 ($Million)
5.5.2. Market Revenue and Forecast, By Region, 2015 - 2026 ($Million)
5.6. Others
5.6.1. Market Revenue and Growth Rate, 2015 - 2026 ($Million)
5.6.2. Market Revenue and Forecast, By Region, 2015 - 2026 ($Million)
CHAPTER 6. INFANT FORMULA INGREDIENTS MARKET BY FORM
6.1. Global Infant Formula Ingredients Revenue By Form
6.2. Powder
6.2.1. Market Revenue and Growth Rate, 2015 - 2026 ($Million)
6.2.2. Market Revenue and Forecast, By Region, 2015 - 2026 ($Million)
6.3. Liquid & Semi-Liquid
6.3.1. Market Revenue and Growth Rate, 2015 - 2026 ($Million)
6.3.2. Market Revenue and Forecast, By Region, 2015 - 2026 ($Million)
CHAPTER 7. NORTH AMERICA INFANT FORMULA INGREDIENTS MARKET BY COUNTRY
7.1. North America Infant Formula Ingredients Market Revenue and Growth Rate, 2015 - 2026 ($Million)
7.2. North America Infant Formula Ingredients Market Revenue Share Comparison, 2015 & 2026 (%)
7.3. U.S.
7.3.1. U.S. Infant Formula Ingredients Market Revenue and Forecast By Type, 2015 - 2026 ($Million)
7.3.2. Market Revenue and Forecast By Application, 2015 - 2026 ($Million)
7.3.3. Market Revenue and Forecast By Form, 2015 - 2026 ($Million)
7.4. Canada
7.4.1. Market Revenue and Forecast By Type, 2015 - 2026 ($Million)
7.4.2. Market Revenue and Forecast By Application, 2015 - 2026 ($Million)
7.4.3. Market Revenue and Forecast By Form, 2015 - 2026 ($Million)
7.5. Mexico
7.5.1. Market Revenue and Forecast By Type, 2015 - 2026 ($Million)
7.5.2. Market Revenue and Forecast By Application, 2015 - 2026 ($Million)
7.5.3. Market Revenue and Forecast By Form, 2015 - 2026 ($Million)
CHAPTER 8. EUROPE INFANT FORMULA INGREDIENTS MARKET BY COUNTRY
8.1. Europe Infant Formula Ingredients Market Revenue and Growth Rate, 2015 - 2026 ($Million)
8.2. Europe Infant Formula Ingredients Market Revenue Share Comparison, 2015 & 2026 (%)
8.3. UK
8.3.1. Market Revenue and Forecast By Type, 2015 - 2026 ($Million)
8.3.2. Market Revenue and Forecast By Application, 2015 - 2026 ($Million)
8.3.3. Market Revenue and Forecast By Form, 2015 - 2026 ($Million)
8.4. Germany
8.4.1. Market Revenue and Forecast By Type, 2015 - 2026 ($Million)
8.4.2. Market Revenue and Forecast By Application, 2015 - 2026 ($Million)
8.4.3. Market Revenue and Forecast By Form, 2015 - 2026 ($Million)
8.5. France
8.5.1. Market Revenue and Forecast By Type, 2015 - 2026 ($Million)
8.5.2. Market Revenue and Forecast By Application, 2015 - 2026 ($Million)
8.5.3. Market Revenue and Forecast By Form, 2015 - 2026 ($Million)
8.6. Spain
8.6.1. Market Revenue and Forecast By Type, 2015 - 2026 ($Million)
8.6.2. Market Revenue and Forecast By Application, 2015 - 2026 ($Million)
8.6.3. Market Revenue and Forecast By Form, 2015 - 2026 ($Million)
8.7. Rest of Europe
8.7.1. Market Revenue and Forecast By Type, 2015 - 2026 ($Million)
8.7.2. Market Revenue and Forecast By Application, 2015 - 2026 ($Million)
8.7.3. Market Revenue and Forecast By Form, 2015 - 2026 ($Million)
CHAPTER 9. ASIA-PACIFIC INFANT FORMULA INGREDIENTS MARKET BY COUNTRY
9.1. Asia-Pacific Infant Formula Ingredients Market Revenue and Growth Rate, 2015 - 2026 ($Million)
9.2. Asia-Pacific Infant Formula Ingredients Market Revenue Share Comparison, 2015 & 2026 (%)
9.3. China
9.3.1. Market Revenue and Forecast By Type, 2015 - 2026 ($Million)
9.3.2. Market Revenue and Forecast By Application, 2015 - 2026 ($Million)
9.3.3. Market Revenue and Forecast By Form, 2015 - 2026 ($Million)
9.4. Japan
9.4.1. Market Revenue and Forecast By Type, 2015 - 2026 ($Million)
9.4.2. Market Revenue and Forecast By Application, 2015 - 2026 ($Million)
9.4.3. Market Revenue and Forecast By Form, 2015 - 2026 ($Million)
9.5. India
9.5.1. Market Revenue and Forecast By Type, 2015 - 2026 ($Million)
9.5.2. Market Revenue and Forecast By Application, 2015 - 2026 ($Million)
9.5.3. Market Revenue and Forecast By Form, 2015 - 2026 ($Million)
9.6. Australia
9.6.1. Market Revenue and Forecast By Type, 2015 - 2026 ($Million)
9.6.2. Market Revenue and Forecast By Application, 2015 - 2026 ($Million)
9.6.3. Market Revenue and Forecast By Form, 2015 - 2026 ($Million)
9.7. South Korea
9.7.1. Market Revenue and Forecast By Type, 2015 - 2026 ($Million)
9.7.2. Market Revenue and Forecast By Application, 2015 - 2026 ($Million)
9.7.3. Market Revenue and Forecast By Form, 2015 - 2026 ($Million)
9.8. Rest of Asia-Pacific
9.8.1. Market Revenue and Forecast By Type, 2015 - 2026 ($Million)
9.8.2. Market Revenue and Forecast By Application, 2015 - 2026 ($Million)
9.8.3. Market Revenue and Forecast By Form, 2015 - 2026 ($Million)
CHAPTER 10. LATIN AMERICA INFANT FORMULA INGREDIENTS MARKET BY COUNTRY
10.1. Latin America Infant Formula Ingredients Market Revenue and Growth Rate, 2015 - 2026 ($Million)
10.2. Latin America Infant Formula Ingredients Market Revenue Share Comparison, 2015 & 2026 (%)
10.3. Brazil
10.3.1. Market Revenue and Forecast By Type, 2015 - 2026 ($Million)
10.3.2. Market Revenue and Forecast By Application, 2015 - 2026 ($Million)
10.3.3. Market Revenue and Forecast By Form, 2015 - 2026 ($Million)
10.4. Argentina
10.4.1. Market Revenue and Forecast By Type, 2015 - 2026 ($Million)
10.4.2. Market Revenue and Forecast By Application, 2015 - 2026 ($Million)
10.4.3. Market Revenue and Forecast By Form, 2015 - 2026 ($Million)
10.5. Rest of Latin America
10.5.1. Market Revenue and Forecast By Type, 2015 - 2026 ($Million)
10.5.2. Market Revenue and Forecast By Application, 2015 - 2026 ($Million)
10.5.3. Market Revenue and Forecast By Form, 2015 - 2026 ($Million)
CHAPTER 11. MIDDLE EAST INFANT FORMULA INGREDIENTS MARKET BY COUNTRY
11.1. Middle East Infant Formula Ingredients Market Revenue and Growth Rate, 2015 - 2026 ($Million)
11.2. Middle East Infant Formula Ingredients Market Revenue Share Comparison, 2015 & 2026 (%)
11.3. Saudi Arabia
11.3.1. Market Revenue and Forecast By Type, 2015 - 2026 ($Million)
11.3.2. Market Revenue and Forecast By Application, 2015 - 2026 ($Million)
11.3.3. Market Revenue and Forecast By Form, 2015 - 2026 ($Million)
11.4. UAE
11.4.1. Market Revenue and Forecast By Type, 2015 - 2026 ($Million)
11.4.2. Market Revenue and Forecast By Application, 2015 - 2026 ($Million)
11.4.3. Market Revenue and Forecast By Form, 2015 - 2026 ($Million)
11.5. Rest of Middle East
11.5.1. Market Revenue and Forecast By Type, 2015 - 2026 ($Million)
11.5.2. Market Revenue and Forecast By Application, 2015 - 2026 ($Million)
11.5.3. Market Revenue and Forecast By Form, 2015 - 2026 ($Million)
CHAPTER 12. AFRICA INFANT FORMULA INGREDIENTS MARKET BY COUNTRY
12.1. Africa Infant Formula Ingredients Market Revenue and Growth Rate, 2015 - 2026 ($Million)
12.2. Africa Infant Formula Ingredients Market Revenue Share Comparison, 2015 & 2026 (%)
12.3. South Africa
12.3.1. Market Revenue and Forecast By Type, 2015 - 2026 ($Million)
12.3.2. Market Revenue and Forecast By Application, 2015 - 2026 ($Million)
12.3.3. Market Revenue and Forecast By Form, 2015 - 2026 ($Million)
12.4. Egypt
12.4.1. Market Revenue and Forecast By Type, 2015 - 2026 ($Million)
12.4.2. Market Revenue and Forecast By Application, 2015 - 2026 ($Million)
12.4.3. Market Revenue and Forecast By Form, 2015 - 2026 ($Million)
12.5. Rest of Africa
12.5.1. Market Revenue and Forecast By Type, 2015 - 2026 ($Million)
12.5.2. Market Revenue and Forecast By Application, 2015 - 2026 ($Million)
12.5.3. Market Revenue and Forecast By Form, 2015 - 2026 ($Million)
CHAPTER 13. COMPANY PROFILE
13.1. Arla Foods Amba
13.1.1. Company Snapshot
13.1.2. Overview
13.1.3. Financial Overview
13.1.4. Type Portfolio
13.1.5. Key Developments
13.1.6. Strategies
13.2. Vitablend Nederland B.V.
13.2.1. Company Snapshot
13.2.2. Overview
13.2.3. Financial Overview
13.2.4. Type Portfolio
13.2.5. Key Developments
13.2.6. Strategies
13.3. Carbery Food Ingredients Limited
13.3.1. Company Snapshot
13.3.2. Overview
13.3.3. Financial Overview
13.3.4. Type Portfolio
13.3.5. Key Developments
13.3.6. Strategies
13.4. Fonterra Co-Operative Group Limited
13.4.1. Company Snapshot
13.4.2. Overview
13.4.3. Financial Overview
13.4.4. Type Portfolio
13.4.5. Key Developments
13.4.6. Strategies
13.5. Fonterra Co-Operative Group Limited
13.5.1. Company Snapshot
13.5.2. Overview
13.5.3. Financial Overview
13.5.4. Type Portfolio
13.5.5. Key Developments
13.5.6. Strategies
13.6. Royal Frieslandcampina N.V.
13.6.1. Company Snapshot
13.6.2. Overview
13.6.3. Financial Overview
13.6.4. Type Portfolio
13.6.5. Key Developments
13.6.6. Strategies
13.7. Sachsenmilch Leppersdorf GmbH
13.7.1. Company Snapshot
13.7.2. Overview
13.7.3. Financial Overview
13.7.4. Type Portfolio
13.7.5. Key Developments
13.7.6. Strategies
13.8. BASF SE
13.8.1. Company Snapshot
13.8.2. Overview
13.8.3. Financial Overview
13.8.4. Type Portfolio
13.8.5. Key Developments
13.8.6. Strategies
13.9. Koninklijke DSM N.V.
13.9.1. Company Snapshot
13.9.2. Overview
13.9.3. Financial Overview
13.9.4. Type Portfolio
13.9.5. Key Developments
13.9.6. Strategies
13.10. Chr. Hansen Holding A/S
13.10.1. Company Snapshot
13.10.2. Overview
13.10.3. Financial Overview
13.10.4. Type Portfolio
13.10.5. Key Developments
13.10.6. Strategies
13.11. Glanbia PLC
13.11.1. Company Snapshot
13.11.2. Overview
13.11.3. Financial Overview
13.11.4. Type Portfolio
13.11.5. Key Developments
13.11.6. Strategies
13.12. Kerry Group PLC
13.12.1. Company Snapshot
13.12.2. Overview
13.12.3. Financial Overview
13.12.4. Type Portfolio
13.12.5. Key Developments
13.12.6. Strategies
The above list of companies is tentative in nature and may change after project initiation depending on company's global presence and foothold in the market
CHAPTER 14. RESEARCH APPROACH
14.1. Research Methodology
14.1.1. Initial Data Search
14.1.2. Secondary Research
14.1.3. Primary Research
14.2. Assumptions and Scope
Buy this premium research report at https://www.acumenresearchandconsulting.com/buy-now/0/735
201, Vaidehi-Saaket, Baner - Pashan Link Rd, Pashan, Pune, Maharashtra 411021
Acumen Research and Consulting (ARC) is a global provider of market intelligence and consulting services to information technology, investment, telecommunication, manufacturing, and consumer technology markets. ARC helps investment communities, IT professionals, and business executives to make fact based decisions on technology purchases and develop firm growth strategies to sustain market competition. With the team size of 100+ Analysts and collective industry experience of more than 200 years, Acumen Research and Consulting assures to deliver a combination of industry knowledge along with global and country level expertise.
Permanent link to this press release:
Copy
Please set a link in the press area of your homepage
to this press release on woodPRI. woodPRI disclaims liability for any content contained in
this release.
Recommend

/newsMicroencapsulation Market Deep Analysis on Key Players - Dow Corning, Encapsys, Syngenta Crop Protection, Evonik Industries, 3M and Bayer
Market Study Report Adds Global Microencapsulation Market Size, Status and Forecast 2024 added to its database. The report provides key statistics on the current state of the industry and other analytical data to understand the market.
Extensive research is required for choosing the appropriate cor...

/newsGermany Airbag Market Size 2023: Global Share, Industry And Report Analysis By 2030 | Hyundai Mobis Co., Ltd. Key Safety Systems, Inc. Robert Bosch GmbH
Germany airbag market is expected to grow at a CAGR of around 6% during the forecast period. Germany Airbag Market research report refers to gathering and analyzing significant market data serve as best medium for various industry players to launch novel product or service. It is vital for key firms...
/newsSecurities Brokerages And Stock Exchanges Market Outlook 2021: Big Things are Happening
A new intelligence report released by HTF MI with title "Global Securities Brokerages And Stock Exchanges Market Survey & Outlook" is designed covering micro level of analysis by Insurers and key business segments, offerings and sales channels. The Global Securities Brokerages And Stock Exchange...

/newsRenewable Chemicals Market Emerging Trends and Competitive Landscape Forecast to 2028
The renewable chemicals market was valued at US$ 80,566.30 million in 2021 and is projected to reach US$ 1,76,750.76 million by 2028 it is expected to grow at a CAGR of 11.9% from 2021 to 2028. The research report focuses on the current market trends, opportunities, future potential of the market, a...
/newsHow Coronavirus is Impacting Cold Brew Coffee, Global Market Volume Analysis, Size, Share and Key Trends 2020-2026
"Market Latest Research Report 2020:
Los Angles United States, February 2020: The Cold Brew Coffee market has been garnering remarkable momentum in the recent years. The steadily escalating demand due to improving purchasing power is projected to bode well for the global market. QY Research's lates...
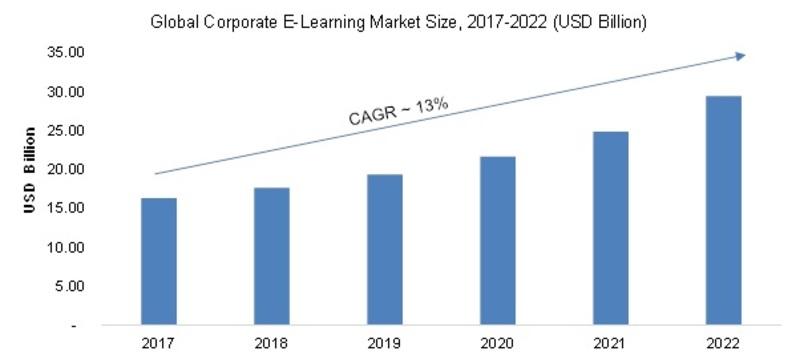
/newsCorporate E-Learning Market - Global Industry Size, Share, Key Players Analysis that are Infor, SkillSoft Corporation, Adrenna, CERTPOINT Systems and others with Regional Forecast to 2022
Overview:
E-Learning is used to enhance the learning procedures for newer job requirements and to make employees sound about the internal and external changes in the market and respective organizations. This method has created considerable differences in the ways of training and developing employee...